Right then Saigon, you say Exile has provided no evidence, I thought I would have a go!
First of all, a major problem with the 'data' collected by these so called global warming scientists is the grea possibility that they have committed a Type I error. The actual timing of the recording of min/max temperatures on a day can massively bias results. I.e only taking recording at 12 noon, and 3am in the morning, versus morning, afternoon and evening fluctuations. Seems a bit interesting to me! Evidence here:
http://www.john-daly.com/tob/TOBSUM.HTM.
This data set here is from the United States Historical Climatology Network
http://www.ncdc.noaa.gov/oa/climate/research/ushcn/ushcn.html#COMPARE . Synopsis? Serious adjustments need to be made to any 'data' to stop bias in observation of temperatures. As you can see, this is an official government source.
Moving on, let's look at the CO2 measurement problems. Scientists examining the Vostok Ice core's for historic climatology noted:
'Using semiempirical models of densification applied to past Vostok climate conditions, Barnola et al. (1991) reported that the age difference between air and ice may be ~6000 years during the coldest periods instead of ~4000 years, as previously assumed.'
Hmmm. So a 2000 year difference in actual versus hypothetical scores - which means again, the analysis of CO2 emissions in antiquity cannot be very accurate. There is a letter here:
http://www.john-daly.com/zjiceco2.htm from Prof. Jaworowski, who is the Chair of the Scientific Council of Central Laboratory for Radiological Protection.
As you noted Saigon, there is a myth that CO2 records show there is a 25% increase in emissions. That letter is evidence to the contrary.
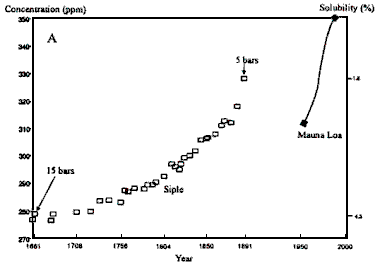
To explain this, in short, the CO2 emissions are not accurate and have to be corrected. The Professor found that in comparison data examined in 1890, is actual concurrent with cycles now. It is best shown on a graph.

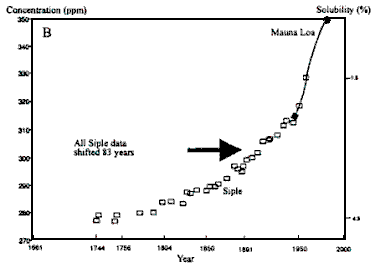
This graph shows some data from Siple in the Antarctic (left side clear squares) and on the left data from Manoa in Hawaii. Now if the Global warming hypothesis is to be believed, then in 1890, CO2 should be around 290ppmv, however as the data needs correcting (due to the age of air - see source), if the corrected data is graphed again we are left with:

This then shows that data from 1890 in Siple, is the same as that of modern Hawaii - i.e the red herring 328ppmv Global Warming scientists waffle on about. This completely refutes the man-made warming hypothesis, as the data from 1890 is the same as 1973 (83 age of air difference).
The conclusion is also quite damning:
The basis of most of the IPCC conclusions on anthropogenic causes and on projections of climatic change is the assumption of low level of CO2 in the pre-industrial atmosphere. This assumption, based on glaciological studies, is false. Therefore IPCC projections should not be used for national and global economic planning. The climatically inefficient and economically disastrous Kyoto Protocol, based on IPCC projections, was correctly defined by President George W. Bush as "fatally flawed". This criticism was recently followed by the President of Russia Vladimir V. Putin. I hope that their rational views might save the world from enormous damage that could be induced by implementing recommendations based on distorted science. I think the most daming evidence is this:

This graph shows average mean temperature temporally versus actual temperatures yearly, for the sea surface temperature. As you can see, we are nowhere near the medieval warm period's temperatures. How can that be? If global warming alarmists posit that we are cuasing climate change, then how do they account for higher temperatures pre-industrial in age ??? in 2000, we were just under the average temperature for the last 3000 years - ergo no man made global warming.
This graph: http://

Further damns the global warming alarmists by clearly showing that the trend for glacier area shortening was happening before the use of hdro-carbons. The trend actually continues perfectly, and also stops (decreases) in 2000.
This graph brings another player into the rebuttal: Solar activity (which influences the Magnetic Heliosphere).

As you can see, Arctic air temperature almost perfectly quadratically correlates (superimposes) itself on solar activity. It's quite an easy hypothesis to understand: Greater solar activity, higher temperature = warmer earth.
Just thought I'd throw a bit of evidence into the mix for you Saigon ;) .


